박스 플롯 차트
박스 플롯 차트는 데이터의 분포를 표현하는 데 유용한 차트 유형이며, 백분위 수 (percentile)의 1사분위(하위 25% 이하, first quartile), 2사분위(하위 25% ~ 50%, second quartile), 3사분위(50% ~ 상위 25%, third quartile), 4사분위(상위 25% 이내, fourth quartile)의 값을 박스와 선으로 표현합니다. 아래 그림은 박스 플롯을 가로 모양으로 표현한 것입니다.
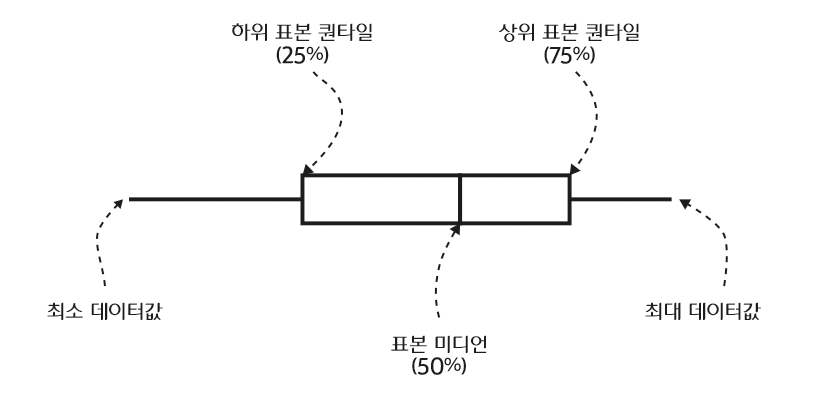
에러바 차트와 마찬가지로 박스 플롯 차트의 값에 해당하는 필드의 형식은 배열이어야 합니다.
박스 플롯 차트는 <BoxPlotChart> 노드의 series 속성값에 <BoxPlotSeries> 노드를 설정하여 생성할 수 있습니다. 다음은 <BoxPlotSeries> 노드의 주요 속성에 대한 설명입니다.
| 속성명 | 유효값 (*: 기본값) | 설명 |
|---|---|---|
| boxStroke |
박스 선의 스타일을 지정합니다. |
|
| halfWidthOffset | 숫자 |
다중 데이터 시리즈일 경우, 이웃하는 박스 사이의 공간을 픽셀값으로 지정합니다. |
| maxColumnWidth | 숫자 |
박스의 최대 넓이를 픽셀값으로 지정합니다. |
| medianStroke |
미디언 값(50%)을 표현하는선의 스타일을 지정합니다. |
|
| medianStroke |
선의 스타일을 지정합니다. |
|
| whiskerWidthRatio | 숫자 기본값: 0.5 |
수염(whisker)의 가로 크기를 박스의 가로 크기에 대한 비율로 지정합니다. |
다음은 박스 플롯 차트를 생성하는 코드와 이를 적용해서 출력한 차트의 예제입니다.
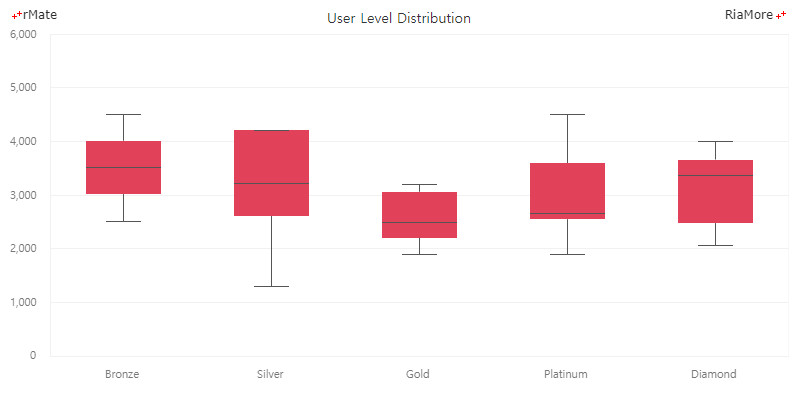
See the CodePen 알메이트 차트 - 박스 플롯 차트
다중 시리즈 박스 플롯 차트
다음은 두 개의 박스 플롯 데이터 시리즈를 표현하는 차트를 생성하는 코드와 이를 적용해서 출력한 차트의 예제입니다.
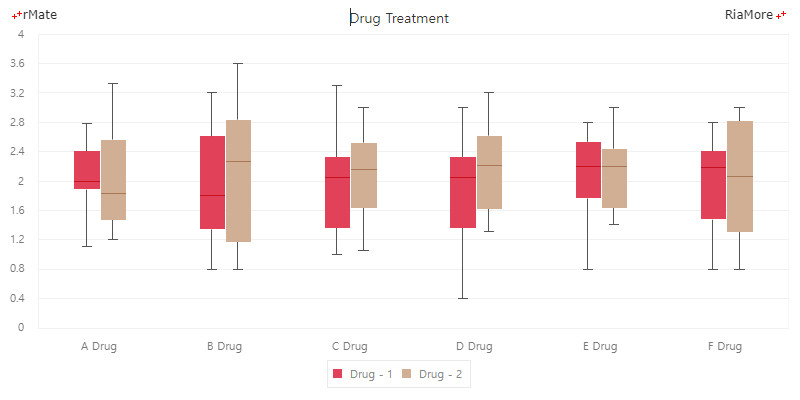
See the CodePen 알메이트 차트 - 다중 시리즈 박스 플롯 차트
박스 플롯 차트 이상치 표시
다음은 박스플롯에 이상치를 표시를 적용해서 출력한 차트의 예제입니다. 이상치를 표시할 경우 이상치를 추가로 고려하여 차트의 모양이 크게 변경됩니다.
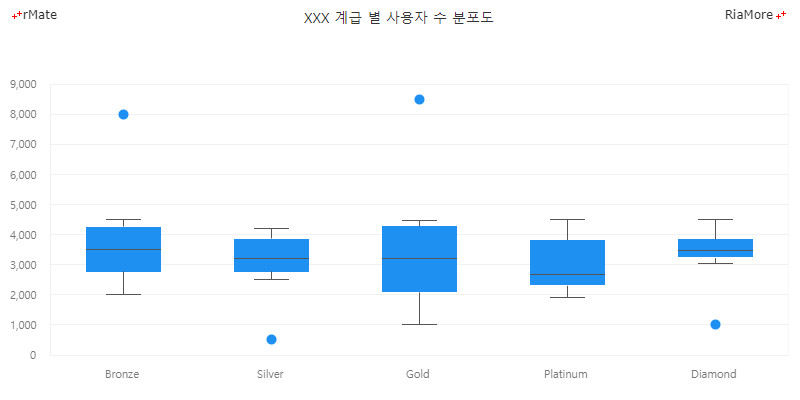
See the CodePen 알메이트 차트 - 박스 플롯 차트 이상치